
NYC Yellow Taxi 2023: where and when demand happens
Exploratory analysis of about 1.8 million New York taxi trips: demand by hour and zone, fares, tips and slow routes, with a zone map and a live demo.
Live
PythonpandasGeoPandasEDAmaps
Built by Kritikesh Rajpurohit, with help from an AI assistant (Claude) for the clean-up and write-up.
Try it
The question
A new taxi operator in New York wants to know when and where to place cabs, which routes waste time, and how fares and tips behave.
What I did
- Took a 5% sample of every date and hour from the 12 monthly 2023 trip files of the NYC Taxi & Limousine Commission: 1,896,378 trips, or 1,799,283 after cleaning.
- Cleaned it with stated rules (impossible passenger counts, negative amounts, extreme fares, distances and durations) and counted what each rule removed.
- Analysed demand by hour, weekday and month; revenue and fare per mile; tips; and pickups by zone on a GeoPandas map.
What I found
| Question | Finding |
|---|---|
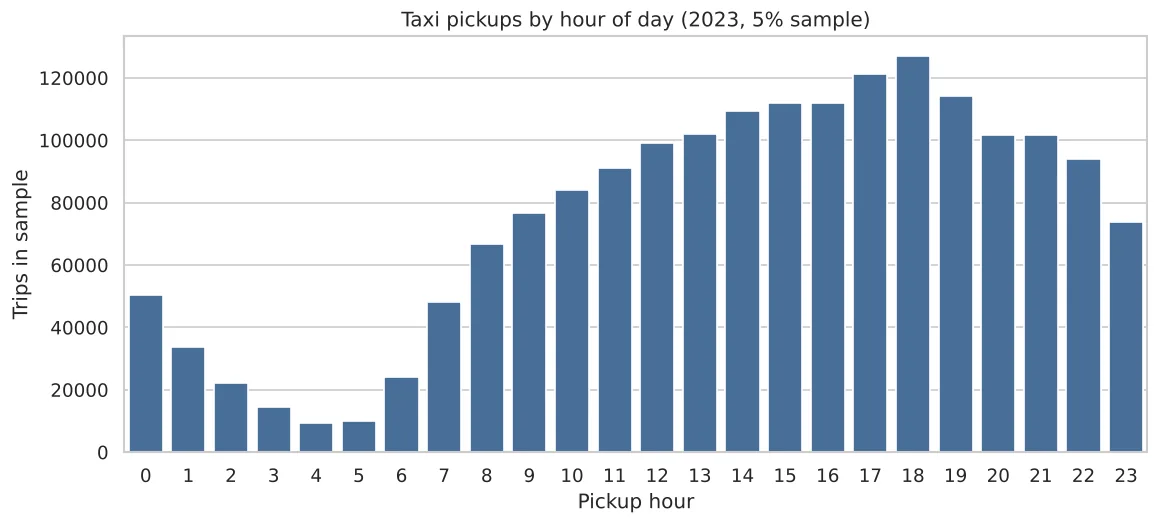
| Busiest hours | 18:00; the top five hours all fall between 15:00 and 19:00 |
| Weekends | After midnight, weekend demand is 2.5 times the weekday level |
| Night (11 PM to 5 AM) | 12.1% of revenue |
| What sets the fare | Distance (r = 0.945) and duration (r = 0.846), not passenger count |
| Airports | JFK has 4.6 times more pickups than drop-offs |
The bug I fixed
My first version had a sampling bug that duplicated 146,450 rows, almost all at 23:00. It made 23:00 look like the busiest hour. After fixing the sampling and rerunning everything, the real peak is 18:00. Checking your own data pipeline matters more than any chart.
Hiring, learning, or just curious?
Tell me which, and your message lands in the right pile.